Punctuality, capacity utilization, lead times, no-shows: The Insights Cockpit collects key performance indicators from your daily operations and makes them actionable. AI summarizes the most important insights directly for your team.







All relevant KPIs and reports are generated automatically from your daily operations: in real-time, interactive, and accessible at any time. You see what is happening and can act immediately.
Data is generated during ongoing processes, from bookings, check-ins, and status updates. No one needs to maintain lists or export files.
The cockpit identifies gaps in the data before they become a problem. Optimization potential is highlighted automatically.
Our Customer Success team reviews the evaluations with you and derives both operational and strategic measures from them.
Four logistics management scenarios and how TradeLink handles each one.
The problem: Metrics are created in Excel at the end of the month: exporting, copying, pasting, and formatting. By the time the report is finished, it is already outdated.
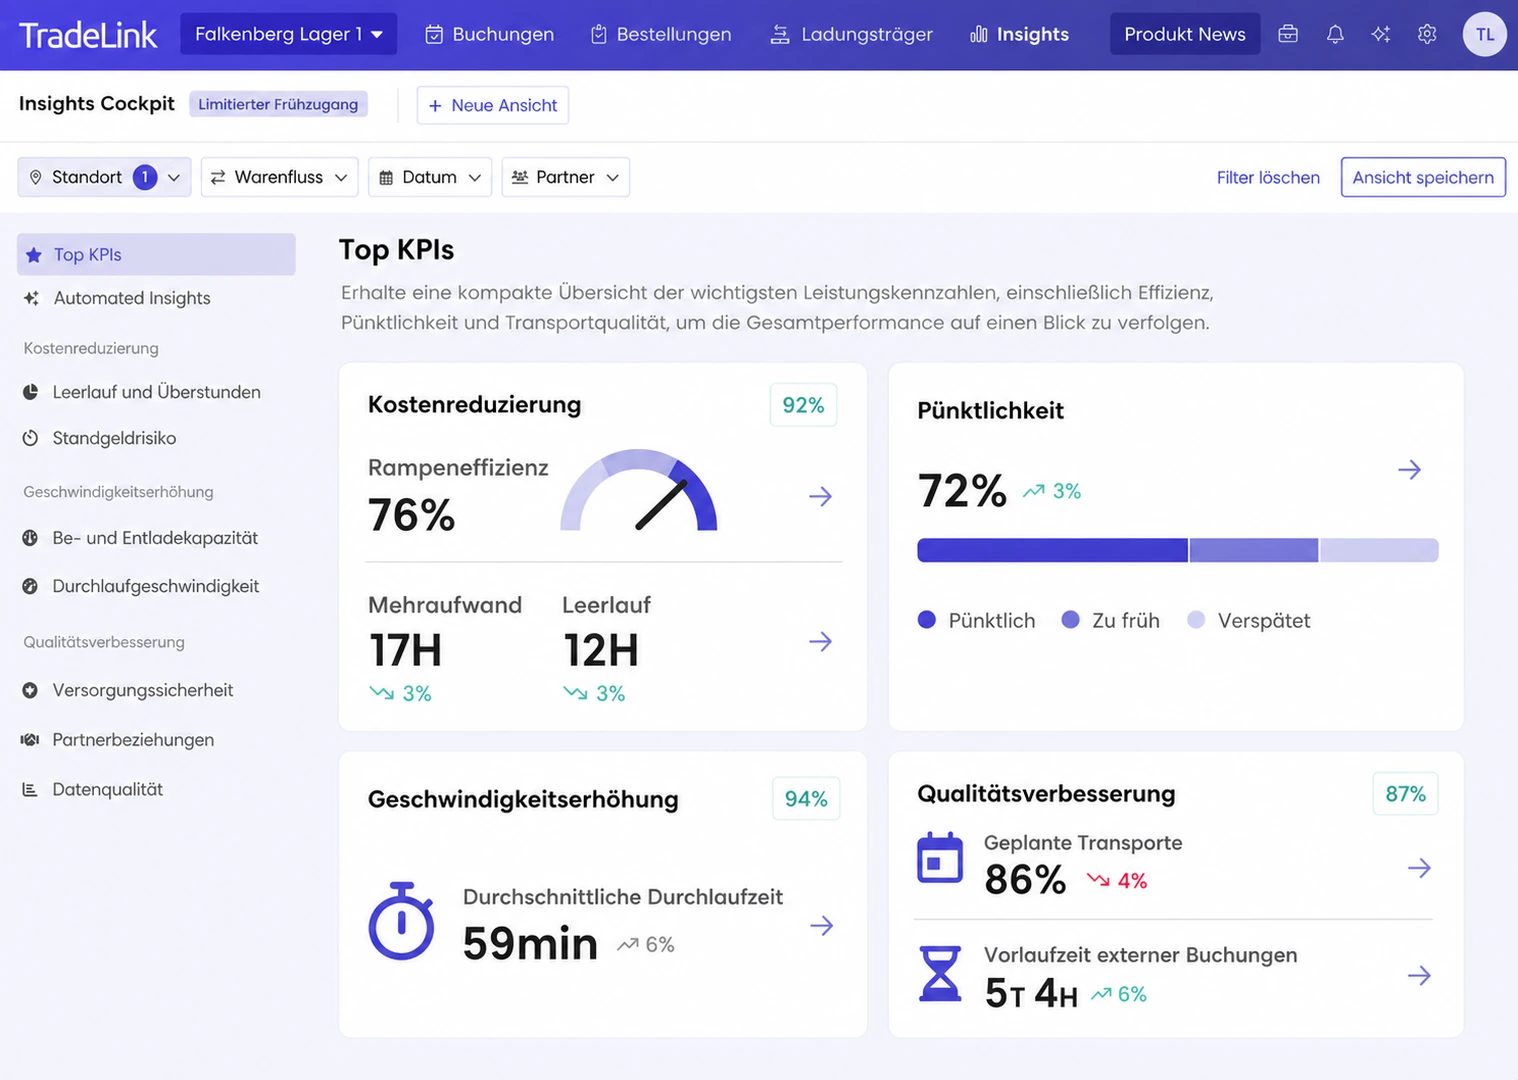
With TradeLink: Punctuality, capacity utilization, idle times, throughput: all KPIs are captured automatically and updated in real time. The executive summary provides a snapshot of your top metrics.
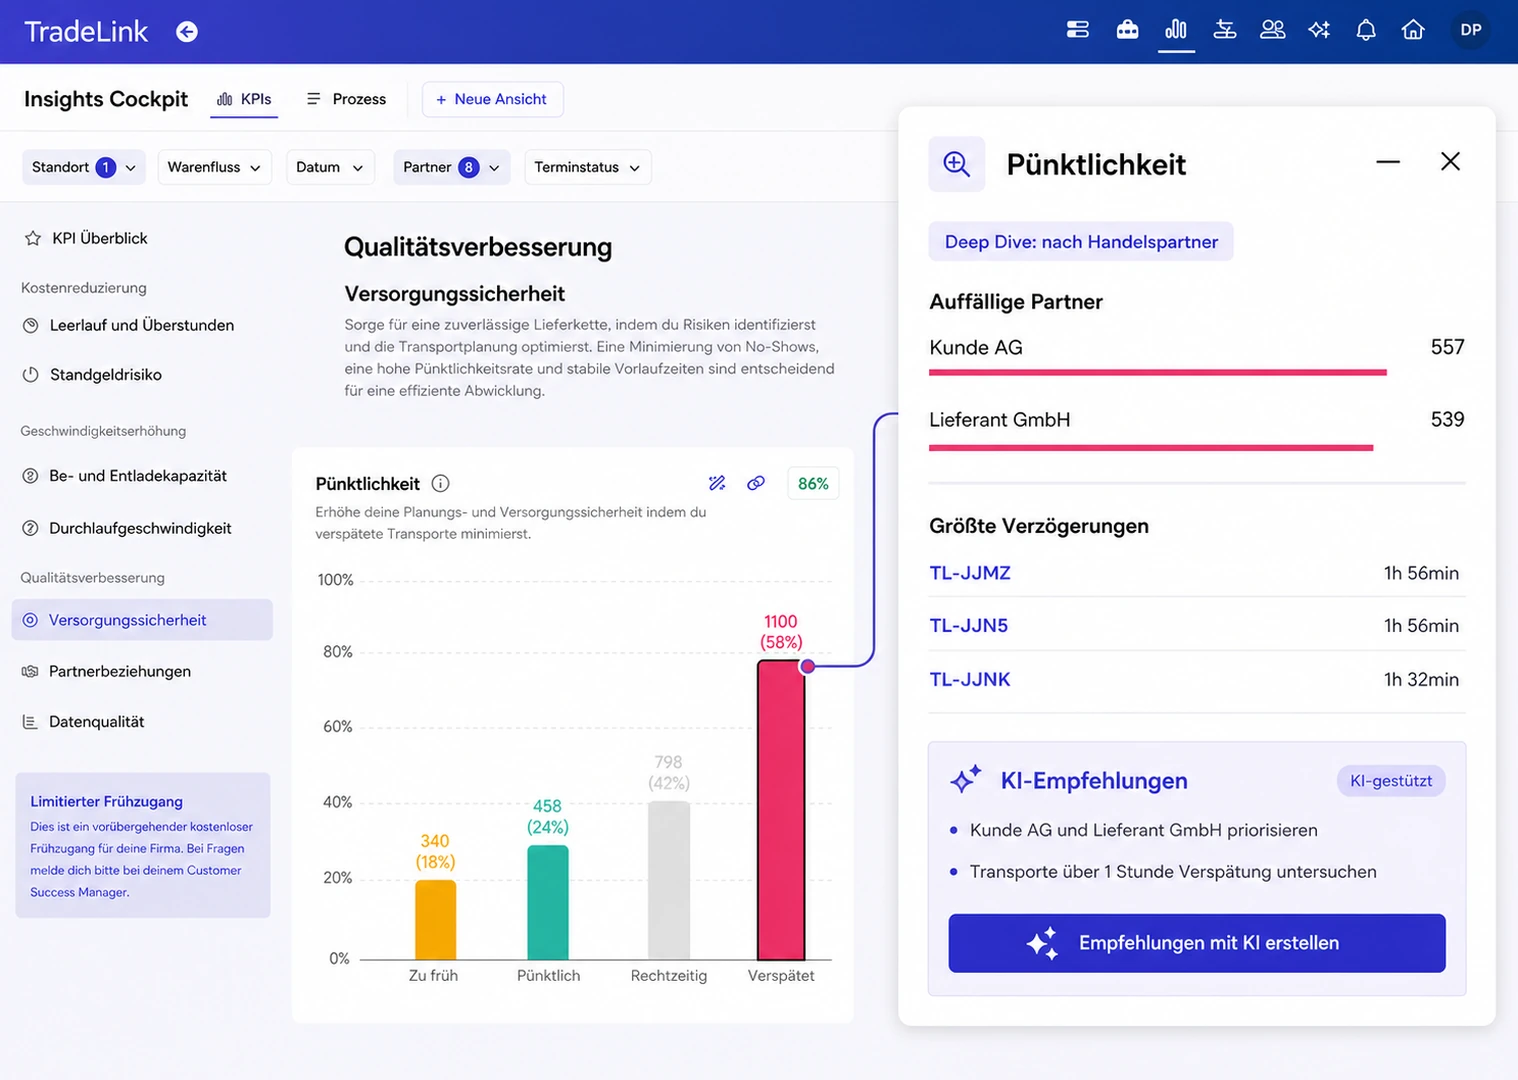
The problem: A question like "Which partner is currently unreliable?" requires someone to create a custom report. By the time it's ready, the question is no longer relevant.
With TradeLink: Analyses by partner, site, time period, or process step run directly in the cockpit. You can save custom views so everyone sees exactly the data they need.
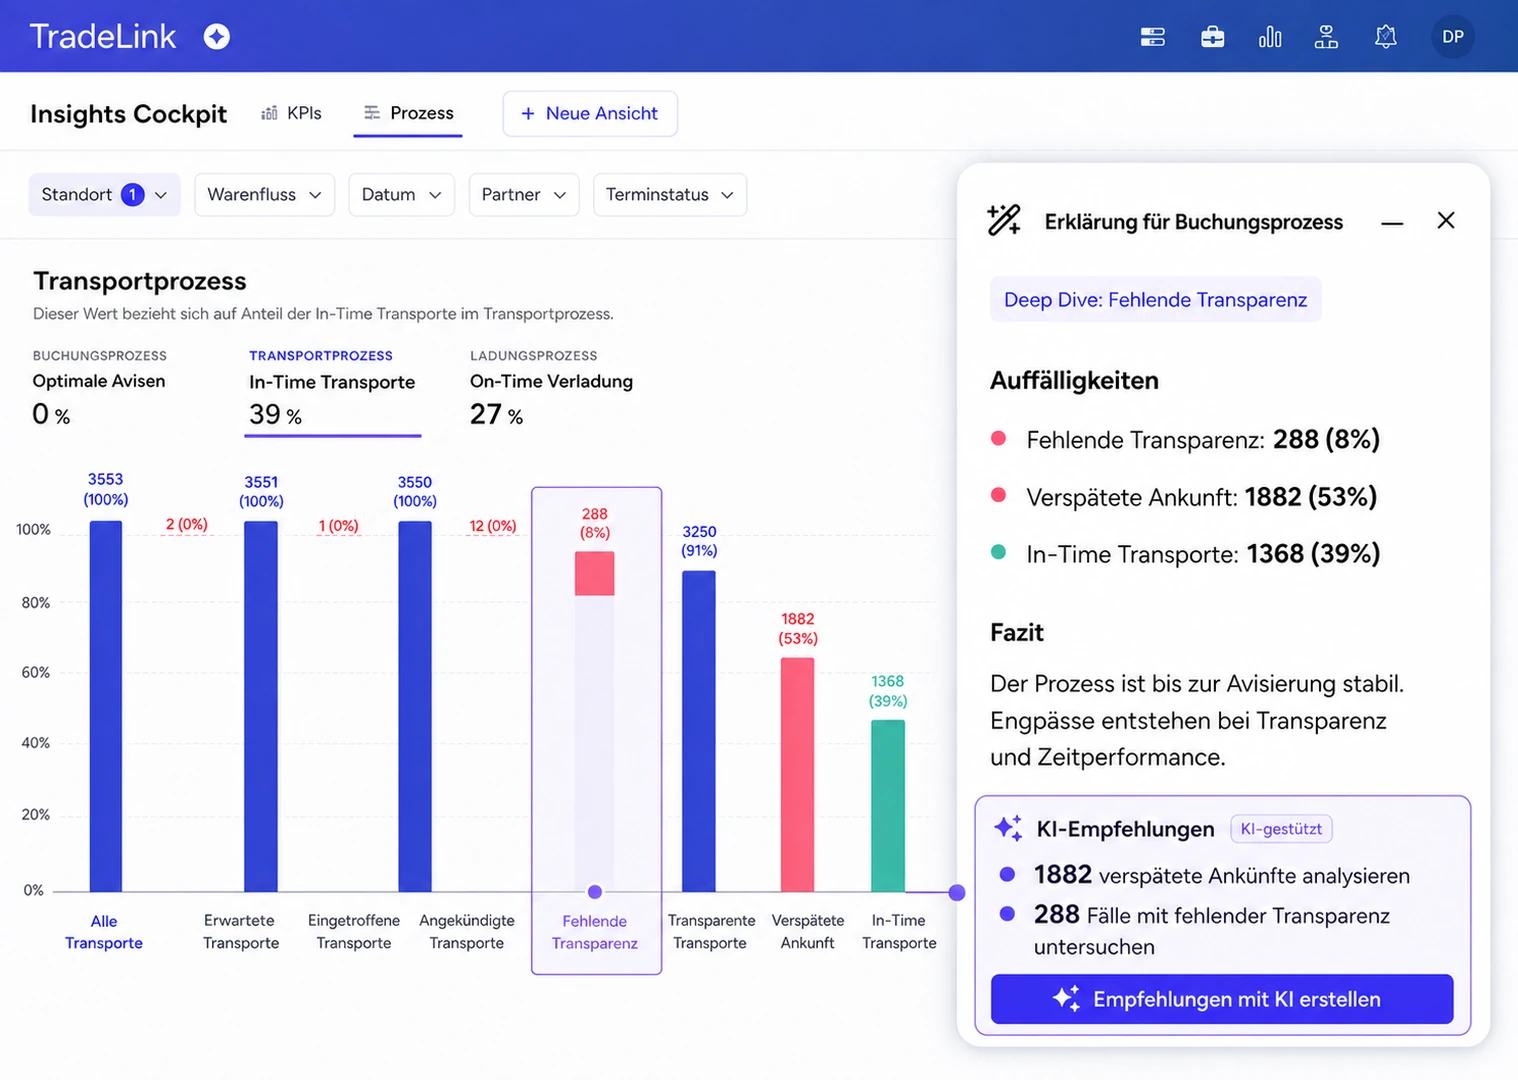
The problem: Metrics are trapped in silos: booking, transport, and unloading are viewed separately. No one can see where the bottleneck is in the overall workflow.
With TradeLink: The process view shows the entire transport lifecycle from booking to loading and unloading. Click on a process stage to open detailed KPIs and view linked charts for immediate analysis.
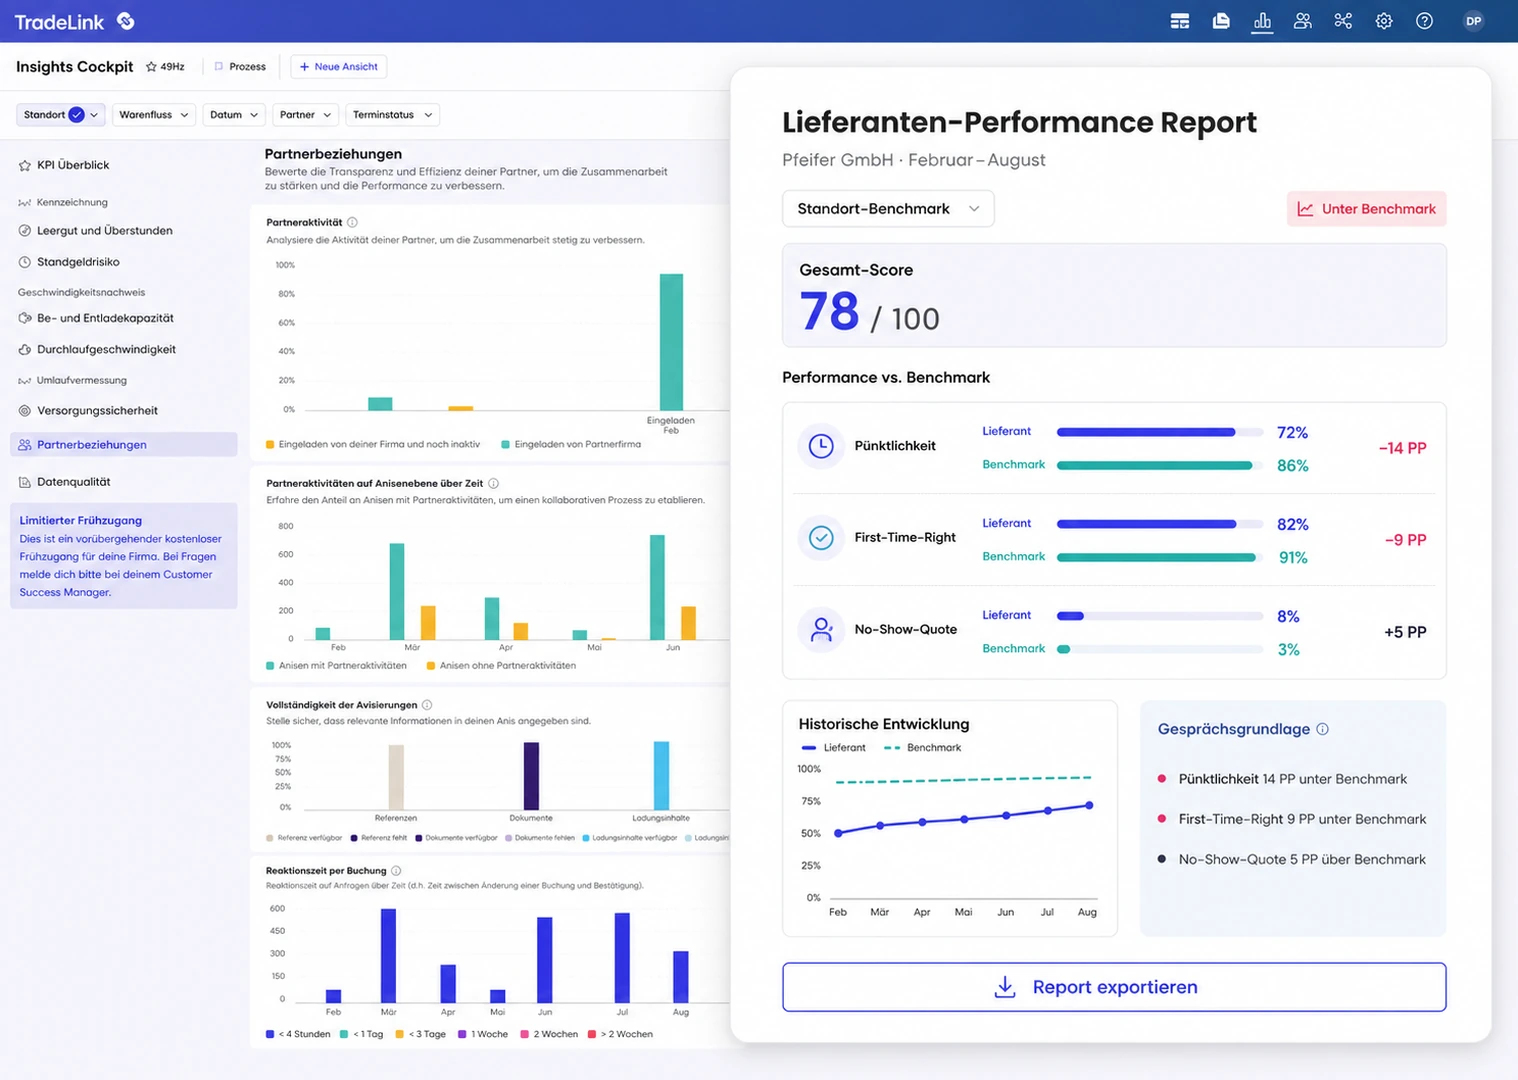
The problem: Supplier meetings often turn into a battle of opinions. Without objective metrics, discussions about no-shows and delays remain inconclusive.
With TradeLink: Site and partner benchmarks compare planned versus actual performance, while historical analyses reveal trends. First-time-right and no-show rates provide an objective basis for discussions.
The cockpit is part of TradeLink. It evaluates the data your operations are already generating, right from day one.
The executive summary displays key performance indicators in real time. You can see at a glance what is working well and where there are bottlenecks.
Deep dives by partner, location, or time period, along with the process view, reveal the root cause behind the numbers, right down to the individual booking.
Benchmarks and automatically identified potential turn data into action. Our Customer Success team provides individual advice on this.
30 minutes with our team, using your actual workflows.
The TradeLink analysis module. It consolidates all processes from booking to unloading into real-time KPIs, dashboards, and reports.
From your ongoing operations: time slot bookings, check-ins, status updates, and load checks. No additional data entry is required.
Among others: punctuality, capacity utilization, idle times, throughput, lead time, no-show rate, and first-time right. Views can be filtered and saved.
The entire transport lifecycle in stages: booking, transport, loading, and unloading. A single click on a stage opens the detailed KPIs.
Yes. You can filter the analysis by partner, view planned versus actual performance, and the AI summary will highlight the most important points to serve as a basis for your discussions.
Yes. After a brief conversation, we will set up a demo environment for you to test using your actual workflows. No strings attached and free of charge.
